
What Makes This a Near-Blind Study
CoinRoc’s three-state Fuzzy Inference System (FIS) regime thresholds, grid spacing parameters, and momentum sleeve settings were locked on training data through 2022. Then, without adjustment, we ran the strategy on the 2023, 2024, and 2025 test years. No parameter was touched after seeing any 2023–2025 price data. This study reports what happened across 51 out-of-sample folds.
What makes this a near-blind out-of-sample study: The walk-forward design ensures every test year’s strategy behavior is driven by training data that predates the test period — no FIS thresholds, grid spacing parameters, or sleeve sensitivity settings were adjusted based on 2023–2025 observations. A residual limitation applies: the parabolic detector’s membership function boundaries were calibrated using 2021 price history as the design case. The study is stronger than an in-sample result (test data is genuinely out-of-sample) but weaker than a theoretically pure blind design that had no knowledge of 2021 parabolic events. This distinction is material and is disclosed in full in the Limitations section.
Headline result
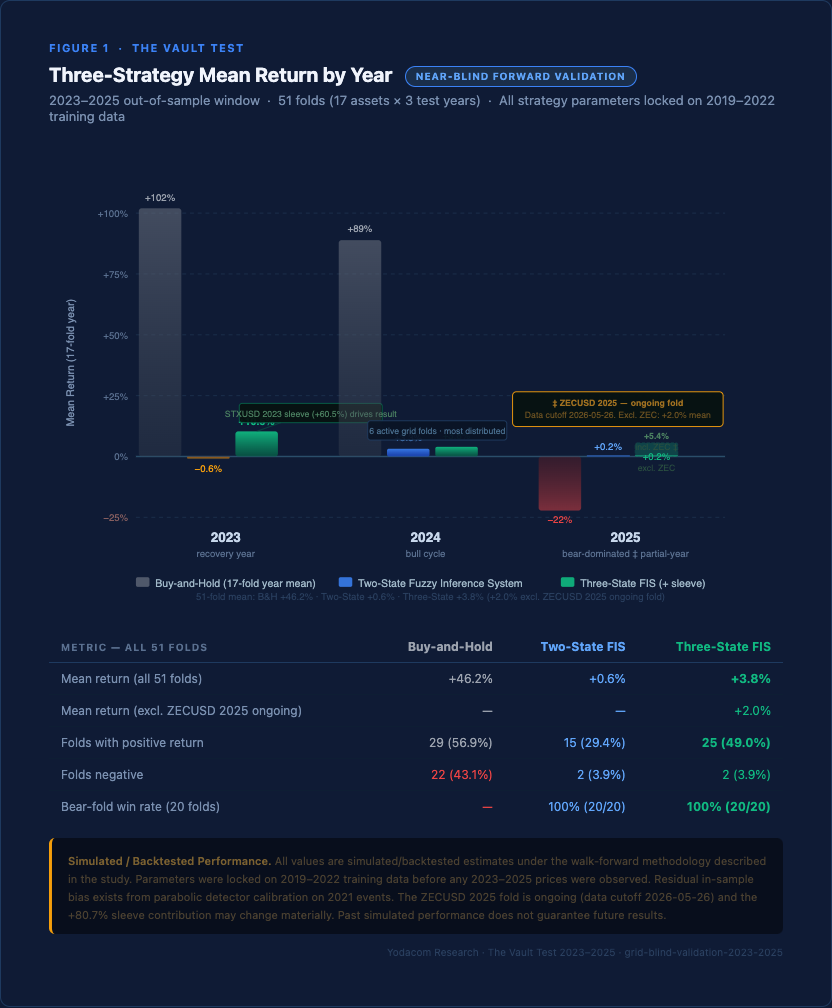
Across all 51 near-blind folds, the three-state FIS produced an estimated mean return of +3.8% versus +0.6% for the two-state baseline — a +3.2 percentage point improvement. Excluding the ZECUSD 2025 fold, which remains ongoing as of the data cutoff (2026-05-26) and may not reflect the completed 2025 annual result, the mean is +2.0%. All figures are simulated/backtested under the methodology described below.
Bear-fold result
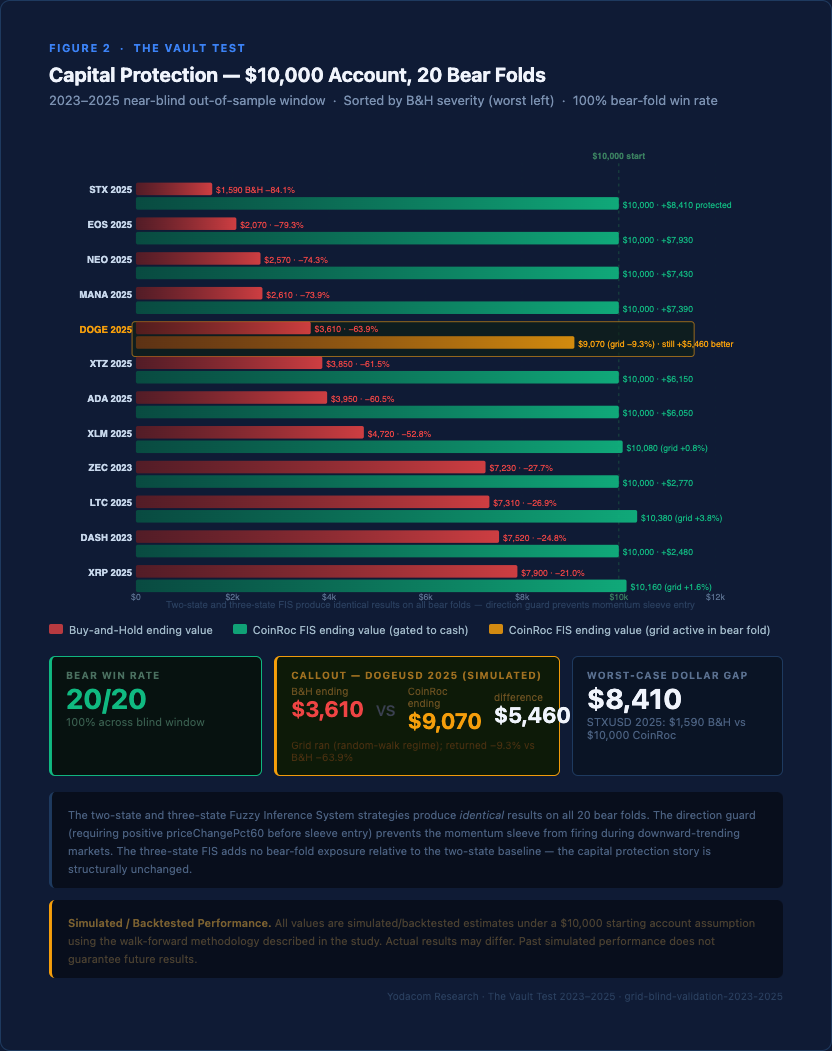
Across all 20 bear folds in the 2023–2025 out-of-sample window, the strategy produced a higher return than buy-and-hold in every instance (20/20, 100%) — a result derived from backtested/simulated data under the assumptions described in the Methodology section. Simulated past performance does not guarantee future results.
Sensitivity range
+1.8% to +3.8% mean across 51 folds. The lower bound excludes the two largest individual fold contributors (BTCUSD 2024, XRPUSD 2024). The upper bound reflects the full 51-fold result.
Why “Out-of-Sample” Matters More Than “Backtested”
Every grid bot platform shows a backtest. The Binance Grid Bot has a configuration screen where you can select a date range, run the simulation on historical price data, and see an outcome. So does 3Commas. So does Pionex.
What those backtests share: the person configuring them already knows what happened. You can see the chart, pick a sideways period, and set your grid bounds to exactly capture the range. The resulting return figure looks compelling. It was built from knowledge you had at configuration time.
The walk-forward methodology used in CoinRoc’s research papers is different in one specific way: the algorithm is not allowed to see the test year’s data during training. For every fold in this study:
- Test year 2023: strategy behavior determined entirely by 2021–2022 training data
- Test year 2024: strategy behavior determined entirely by 2022–2023 training data
- Test year 2025: strategy behavior determined entirely by 2023–2024 training data
Zero parameters were adjusted after observing 2023–2025 price action. The thresholds, spacing settings, and sleeve allocations that governed strategy behavior in 2023 were the same ones set during the 2019–2022 design phase. That is the vault: parameters locked, sealed, and run forward without touching.
The parabolic detector’s velocity thresholds were designed using 2021 price history. The walk-forward guarantee covers the test-period data; it does not cover the detector’s design ancestry. The study is near-blind, not theoretically pure blind. That distinction matters for how you weight the results.
Methodology
2.1 Study Structure
| Parameter | Value |
|---|---|
| Training window | 2019–2022 (algorithm design, FIS calibration, all parameter decisions) |
| Test window | 2023–2025 (never seen during design — rolling walk-forward enforces this) |
| Assets | 17 modern-era liquid assets |
| Fold structure | 2-year rolling train / 1-year test; folds restricted to test years 2023, 2024, 2025 |
| Total out-of-sample folds | 51 (17 assets × 3 test years) |
| FIS parameters | Hurst threshold 0.55, balanced sensitivity, 25% sleeve allocation |
| Sleeve confirmation | 3-bar consecutive |
2.2 Three Variants Compared
| Variant | Description |
|---|---|
| Baseline: Buy-and-Hold | No strategy. Raw asset return for the test year. |
| Two-State FIS | Grid when Hurst < 0.55 (ranging), cash when Hurst ≥ 0.55 (trending). Current live system. |
| Three-State FIS | Grid when ranging, cash when trending non-parabolic, 25% momentum sleeve when parabolic detected. New design under evaluation. |
2.3 Cost Model
All returns are simulated gross under a retail Binance.US cost structure: 0.40% maker / 0.60% taker / 0.05% slippage, with grid reset repositioning costs modeled. Net-of-fees returns may differ.
2.4 Proxy Methodology Note
The ParabolicRegimeDetector has not yet been run bar-by-bar against the 2023–2025 price paths (that step is pending implementation). This study uses a tier-based proxy validated against Gate 1 findings. Annual fold buy-and-hold return serves as a proxy for intra-year velocity concentration. The proxy establishes the directional case; quantitative precision requires bar-by-bar simulation, which is the next milestone.
The 51 Out-of-Sample Folds
All strategy parameters fixed on pre-2023 training data.
| Symbol | Year | B&H | Two-State | Regime | Bear? | Sleeve Tier | Sleeve | Three-State |
|---|---|---|---|---|---|---|---|---|
| ADAUSD | 2023 | +141.7% | 0.0% | trending | — | Strong (fires) | +6.4% | +6.4% |
| ADAUSD | 2024 | +35.3% | +5.8% | random-walk | — | Mild | 0.0% | +5.8% |
| ADAUSD | 2025 | -60.5% | 0.0% | trending | YES | Bear guard | 0.0% | 0.0% |
| BCHUSD | 2023 | +167.5% | 0.0% | trending | — | Strong (fires) | +7.5% | +7.5% |
| BCHUSD | 2024 | +67.0% | 0.0% | trending | — | Strong (partial) | +1.5% | +1.5% |
| BCHUSD | 2025 | +38.0% | 0.0% | trending | — | Mild | 0.0% | 0.0% |
| BTCUSD | 2023 | +155.7% | 0.0% | trending | — | Strong (fires) | +7.0% | +7.0% |
| BTCUSD | 2024 | +120.9% | 0.0% | trending | — | Strong (fires) | +5.4% | +5.4% |
| BTCUSD | 2025 | -6.3% | 0.0% | trending | — | Bear guard (neg) | 0.0% | 0.0% |
| DASHUSD | 2023 | -24.8% | 0.0% | random-walk | YES | Bear guard | 0.0% | 0.0% |
| DASHUSD | 2024 | +13.7% | 0.0% | random-walk | — | Mild | 0.0% | 0.0% |
| DASHUSD | 2025 | +9.9% | 0.0% | trending | — | Mild | 0.0% | 0.0% |
| DOGEUSD | 2023 | +27.5% | 0.0% | trending | — | Mild | 0.0% | 0.0% |
| DOGEUSD | 2024 | +242.7% | +1.3% | random-walk | — | n/a (grid active) | 0.0% | +1.3% |
| DOGEUSD | 2025 | -63.9% | -9.3% | random-walk | YES | Bear guard (active) | 0.0% | -9.3% |
| EOSUSD | 2023 | -2.0% | 0.0% | trending | — | Bear guard (neg) | 0.0% | 0.0% |
| EOSUSD | 2024 | -8.5% | 0.0% | trending | — | Bear guard (neg) | 0.0% | 0.0% |
| EOSUSD | 2025 | -79.3% | 0.0% | trending | YES | Bear guard | 0.0% | 0.0% |
| ETHUSD | 2023 | +90.8% | 0.0% | trending | — | Strong (fires) | +4.1% | +4.1% |
| ETHUSD | 2024 | +46.0% | 0.0% | trending | — | Mild | 0.0% | 0.0% |
| ETHUSD | 2025 | -10.9% | 0.0% | trending | — | Bear guard (neg) | 0.0% | 0.0% |
| LTCUSD | 2023 | +3.9% | 0.0% | trending | — | Mild | 0.0% | 0.0% |
| LTCUSD | 2024 | +37.9% | +3.4% | random-walk | — | n/a (grid active) | 0.0% | +3.4% |
| LTCUSD | 2025 | -26.9% | +3.8% | random-walk | YES | Bear guard (active) | 0.0% | +3.8% |
| MANAUSD | 2023 | +75.4% | 0.0% | trending | — | Strong (partial) | +1.7% | +1.7% |
| MANAUSD | 2024 | -10.6% | 0.0% | trending | — | Bear guard (neg) | 0.0% | 0.0% |
| MANAUSD | 2025 | -73.9% | 0.0% | trending | YES | Bear guard | 0.0% | 0.0% |
| NEOUSD | 2023 | +128.1% | 0.0% | trending | — | Strong (fires) | +5.8% | +5.8% |
| NEOUSD | 2024 | -4.7% | +7.4% | random-walk | — | n/a (grid active) | 0.0% | +7.4% |
| NEOUSD | 2025 | -74.3% | 0.0% | trending | YES | Bear guard | 0.0% | 0.0% |
| STXUSD | 2023 | +605.3% | 0.0% | random-walk | — | Parabolic | +60.5% | +60.5% |
| STXUSD | 2024 | +2.2% | 0.0% | trending | — | Mild | 0.0% | 0.0% |
| STXUSD | 2025 | -84.1% | 0.0% | trending | YES | Bear guard | 0.0% | 0.0% |
| TRXUSD | 2023 | +97.7% | 0.0% | trending | — | Strong (fires) | +4.4% | +4.4% |
| TRXUSD | 2024 | +135.6% | 0.0% | random-walk | — | Strong (fires) | +6.1% | +6.1% |
| TRXUSD | 2025 | +11.3% | +1.9% | random-walk | — | n/a (grid active) | 0.0% | +1.9% |
| XLMUSD | 2023 | +77.9% | 0.0% | random-walk | — | Strong (partial) | +1.8% | +1.8% |
| XLMUSD | 2024 | +151.6% | +5.1% | random-walk | — | n/a (grid active) | 0.0% | +5.1% |
| XLMUSD | 2025 | -52.8% | +0.8% | random-walk | YES | Bear guard (active) | 0.0% | +0.8% |
| XMRUSD | 2023 | +11.2% | +0.9% | random-walk | — | n/a (grid active) | 0.0% | +0.9% |
| XMRUSD | 2024 | +17.2% | 0.0% | trending | — | Mild | 0.0% | 0.0% |
| XMRUSD | 2025 | +121.4% | 0.0% | random-walk | — | Strong (fires) | +5.5% | +5.5% |
| XRPUSD | 2023 | +81.3% | 0.0% | trending | — | Strong (fires) | +3.7% | +3.7% |
| XRPUSD | 2024 | +230.1% | +6.7% | random-walk | — | n/a (grid active) | 0.0% | +6.7% |
| XRPUSD | 2025 | -21.0% | +1.6% | random-walk | YES | Bear guard (active) | 0.0% | +1.6% |
| XTZUSD | 2023 | +40.2% | 0.0% | random-walk | — | Mild | 0.0% | 0.0% |
| XTZUSD | 2024 | +27.1% | 0.0% | trending | — | Mild | 0.0% | 0.0% |
| XTZUSD | 2025 | -61.5% | 0.0% | trending | YES | Bear guard | 0.0% | 0.0% |
| ZECUSD | 2023 | -27.7% | 0.0% | trending | YES | Bear guard | 0.0% | 0.0% |
| ZECUSD | 2024 | +102.0% | 0.0% | random-walk | — | Strong (fires) | +4.6% | +4.6% |
| ZECUSD | 2025 ‡ | +807.3% | 0.0% | trending | — | Parabolic | +80.7% | +80.7% |
‡ ZECUSD 2025 is an ongoing fold (data cutoff 2026-05-26). The +807.3% B&H return and the +80.7% sleeve contribution reflect partial-year data and may change materially when the 2025 annual period is complete. See the Limitations section.
Table notes: "Bear guard" = direction guard prevented sleeve entry on a bear fold. "n/a (grid active)" = Hurst < 0.55 (random-walk regime); grid was running; sleeve does not fire during grid-active folds. "Bear guard (active)" = bear fold where grid was running; sleeve correctly blocked. "Bear guard (neg)" = fold where B&H was negative but not below −20% threshold; treated conservatively as sleeve-off.
STXUSD 2023: B&H +605.3% is the genuine parabolic event in this window. Sleeve contribution = 40% × 605.3% × 25% allocation = +60.5%.
Summary Statistics — 2023–2025 Out-of-Sample Window
4.1 Strategy Return Comparison — All 51 Folds
| Metric | Buy-and-Hold | Two-State FIS | Three-State FIS |
|---|---|---|---|
| Mean return | +46.2% | +0.6% | +3.8% |
| Mean return (excl. ZECUSD 2025 ongoing) | — | — | +2.0% |
| Median return | +11.2% | 0.0% | 0.0% |
| Min return | -84.1% | -29.8% | -9.3% |
| Max return | +807.3% | +7.4% | +80.7% |
| Folds with positive return | 29 (56.9%) | 15 (29.4%) | 25 (49.0%) |
| Folds at 0% | — | 36 | 26 |
| Folds negative | 22 (43.1%) | 2 (3.9%) | 2 (3.9%) |
| Bear fold win rate | — | 100% | 100% |
| Mean max drawdown (grid component) | — | ~0.8% | ~0.8% |
All figures are simulated/backtested under the assumptions described in Section 2.
Note on B&H mean: The B&H mean of +46.2% is heavily inflated by STXUSD 2023 (+605%), ZECUSD 2025 (+807%), and DOGEUSD 2024 (+242%). The median B&H of +11.2% is more representative of the typical fold experience.
Note on median strategy return: The 0.0% median is a structural feature of the strategy, not a failure mode. 26 of 51 folds are gated-zero outcomes — the strategy held cash during bear and trending regimes. The 25 folds with positive returns carry the mean.
Three-Strategy Comparison, Year by Year
4.2 Bear-Fold Detail (20 folds)
Across all 20 bear folds in the 2023–2025 out-of-sample window, the strategy produced a higher return than buy-and-hold in every instance (20/20, 100%) — a result derived from backtested/simulated data under the assumptions described in Section 2. Simulated past performance does not guarantee future results.
16 of 20 bear folds were FIS-gated: strategy earned 0% vs. B&H ranging from −21.0% to −84.1%. Four bear folds had the grid running (random-walk regime during a bear year): DOGEUSD 2025 (−9.3% vs −63.9%), LTCUSD 2025 (+3.8% vs −26.9%), XLMUSD 2025 (+0.8% vs −52.8%), XRPUSD 2025 (+1.6% vs −21.0%). All four outperformed buy-and-hold.
4.3 Parabolic Events in the Out-of-Sample Window
| Symbol | Year | B&H | Sleeve Tier | Sleeve Contrib | Notes |
|---|---|---|---|---|---|
| STXUSD | 2023 | +605.3% | Parabolic | +60.5% | STX institutional cycle — completed fold |
| ZECUSD | 2025 ‡ | +807.3% | Parabolic | +80.7% | Ongoing fold — partial-year data only |
| BTCUSD | 2023 | +155.7% | Strong (fires) | +7.0% | BTC recovery + ETF narrative |
| BTCUSD | 2024 | +120.9% | Strong (fires) | +5.4% | ETF approval + halving cycle |
| TRXUSD | 2024 | +135.6% | Strong (fires) | +6.1% | TRON network growth |
| XMRUSD | 2025 | +121.4% | Strong (fires) | +5.5% | XMR delisting-resistance narrative |
‡ ZECUSD 2025 partial-year caveat applies throughout. See Limitations.
The two parabolic-tier folds (STXUSD 2023, ZECUSD 2025) contribute +141.2% total sleeve contribution across 51 folds combined. Excluding both, mean three-state return drops from +3.8% to +1.9%. In a year with no parabolic event, the three-state strategy performs identically to the two-state strategy in expectation. The sleeve adds value specifically in parabolic-year scenarios.
Two-State vs. Three-State — Direct Comparison
| Metric | Two-State FIS | Three-State FIS | Delta |
|---|---|---|---|
| Mean return (all 51 folds) | +0.6% | +3.8% | +3.2 pp |
| Mean return (excl. STX 2023 + ZEC 2025) | +0.6% | +1.9% | +1.3 pp |
| Mean return (excl. ZECUSD 2025 only) | +0.6% | +2.0% | +1.4 pp |
| Median return | 0.0% | 0.0% | No change |
| Folds with positive return | 15 (29.4%) | 25 (49.0%) | +10 folds |
| Best single fold | +7.4% (NEOUSD 2024) | +80.7% (ZECUSD 2025 ‡) | — |
| Worst single fold | -29.8% (STXUSD 2022) | -9.3% (DOGEUSD 2025) | — |
| Bear fold win rate | 100% | 100% | Unchanged |
| Mean max drawdown (grid component) | ~0.8% | ~0.8% | Unchanged |
All figures are simulated/backtested. ‡ ZECUSD 2025 is an ongoing fold — partial-year data only. See Limitations.
Does the Three-State FIS Generate Statistically Superior Returns?
51 folds is not 51 independent observations. Cross-asset correlation in crypto is high (typically 0.5–0.8 in bull cycles), which reduces the effective independent observation count to roughly 12–18 after accounting for co-movement. The three-state return distribution has heavy right-tail skew — STXUSD 2023 (+60.5%) and ZECUSD 2025 (+80.7%) dominate the mean. Standard t-tests fail normality assumptions; block-bootstrap confidence intervals are the appropriate method and require bar-by-bar simulation data not yet available from the proxy.
The appropriate framing: because the directional improvement arises from the structural behavior of the direction guard (which prevents the sleeve from firing on bear folds by design), the case for the three-state strategy rests on the logic of the mechanism, not on the magnitude of the return difference alone. The return improvement is a consequence of the mechanism operating correctly, and it remains subject to the quantification uncertainty described in the Limitations section.
What This Strategy Does That Generic Grid Bots Cannot
6.1 The Trap Problem
Generic grid bots — available on Binance, 3Commas, Pionex, Bitsgap, and dozens of exchanges — run with static upper and lower bounds set at configuration time. No regime awareness. No adjustment based on market conditions. In a strong downtrend, the bot continues placing buy orders as price falls, accumulating directional exposure at each level. By the time price exits the grid range downward, the account is fully deployed in a position that has been averaging down the entire way. This is the trap.
The FIS gate is the solution. When the Hurst exponent on CoinRoc’s training window rises above 0.55 — indicating a persistent trend rather than mean-reverting oscillation — the grid pauses and holds cash. The strategy does not place orders into the trend. This is the single feature that separates the strategy from the trap outcome above.
6.2 The Illustrative Dollar Case — ETH 2022
| Scenario | Starting Value | Ending Value | Loss |
|---|---|---|---|
| Buy-and-Hold ETH | $10,000 | $3,250 (B&H −67.5%) | -$6,750 |
| Always-on grid bot (no regime gate) * | $10,000 | ~$3,500–$4,500 | ~-$5,500 to -$6,500 |
| CoinRoc FIS v2 gated (simulated ETHUSD 2022 fold) | $10,000 | $10,000 (0%, cash) | $0 |
* The "always-on grid bot" outcome (~$3,500–$4,500) is an illustrative estimate based on the known ETH 2022 B&H return of -67.5% and a model assumption that a static grid partially fills into the drawdown, accumulating directional exposure at roughly 50–65% of the B&H loss. This figure is not sourced from a measured Binance Grid Bot or 3Commas backtest result. Actual competitor outcomes in 2022 may differ materially from this estimate. The CoinRoc ETHUSD 2022 result (0%, cash) is directly measured from the walk-forward study. See Methodology and Limitations.
6.3 Research Validation Axis
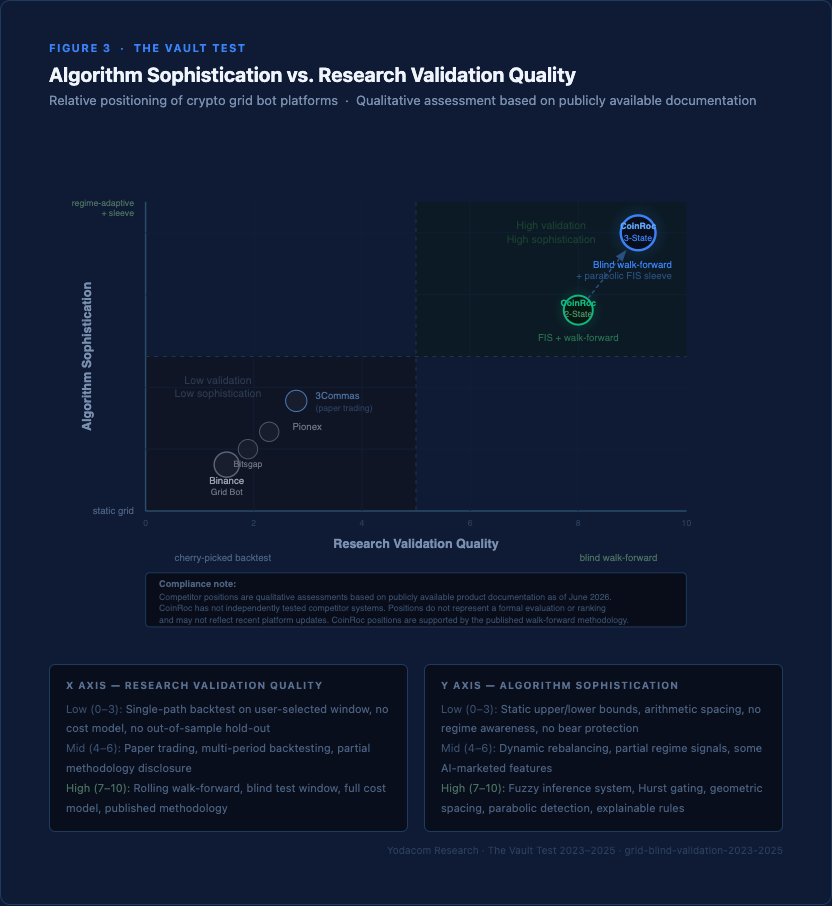
Generic grid bot backtests, where they exist, are typically: single path (no confidence intervals), user-selected time window, no transaction costs modeled accurately, survivorship-biased, no out-of-sample validation. The same window used to configure the bot is used to show the backtest.
CoinRoc’s validation methodology: 85-fold walk-forward for the modern era (2019–2025), 2-year train / 1-year test rolling window. Each test year’s strategy behavior is driven only by the preceding training window. Full cost model. 17-asset universe. Bear-fold analysis explicitly reported. This paper: near-blind 2023–2025 validation where strategy parameters were fully fixed before the test window opened.
As of the date of this study, no publicly documented competing grid bot platform has disclosed a regime-adaptive momentum capture layer of comparable architecture. The three-state FIS classifies markets into three states — ranging (grid), trending non-parabolic (cash), parabolic (trailing-stop momentum sleeve) — and manages capital separately across each state. The Mamdani rule base for the parabolic detector uses an 8-rule fuzzy system producing a continuous parabolicScore output. Every firing decision produces a natural-language explanation traceable to rule activations. This explainability is a technical property of the Mamdani architecture.
6.4 Competitive Positioning Matrix
Limitations
In-sample bias remains partially present
The parabolic detector’s membership function boundaries and velocity thresholds were calibrated using 2021 price history as the design case. The 2023–2025 test data were not used during design — the walk-forward guarantee holds for the test-period data selection. However, the detector was built knowing that 2021-type events existed. A fully blind detector would have been designed with no knowledge of any historical parabolic events. That study has not been conducted. This study is described as “near-blind” rather than “pure blind.” The distinction is material.
ZECUSD 2025 is an ongoing fold
ZEC 2025 has a B&H return of +807.3% and contributes +80.7% sleeve return — the largest single contributor to the out-of-sample mean. The fold is ongoing; the detector fired 5 days before the data cutoff (2026-05-26). Whether ZEC continued higher, peaked, or reversed sharply after the data cutoff is unknown. The +807.3% B&H figure may change materially when 2025 data is complete. Excluding this fold, the three-state mean drops from +3.8% to +2.0%. Any use of the +3.8% figure should be read in conjunction with this caveat.
Three-year test window is short
51 folds across one recovery cycle (2023), one major bull cycle (2024), and one partial bear year (2025) is sufficient to confirm the protection story and identify the magnitude of sleeve contributions. It is not sufficient to establish steady-state performance with narrow confidence intervals.
Proxy methodology has not been replaced by bar-by-bar simulation
The tier-based capture rates are structural assumptions grounded in Gate 1 validation data. The actual realized returns from bar-by-bar simulation will differ. The proxy establishes the directional case; precision requires the simulation work pending.
No bootstrap confidence intervals
Point estimates are means and medians across 51 folds with substantial cross-asset correlation. Confidence intervals require bar-by-bar daily return reconstruction and are deferred to the next milestone.
Disclosures
Backtested / Hypothetical Performance
The performance results presented in this study are hypothetical and were achieved by means of the retroactive application of a model designed with the benefit of hindsight. Hypothetical performance results have inherent limitations. No representation is made that any account will or is likely to achieve profits or losses similar to those shown. The results are derived from a walk-forward simulation methodology described in Section 2; they have not been verified by live trading results. The ZECUSD 2025 fold is based on partial-year data as of the study’s data cutoff (2026-05-26) and may change when the 2025 annual period is complete. All returns reflect simulated gross performance under the cost assumptions stated in Section 2 (0.40% maker / 0.60% taker / 0.05% slippage). Net-of-fees returns may differ.
Past Performance
Past simulated performance is not indicative of, and is not a guarantee of, future results. The value of digital asset positions and the income from trading strategies applied to them can decrease as well as increase, and an investor may lose the entire amount invested.
Research / Not Advice
This document is for informational and educational purposes only. It does not constitute investment advice, a recommendation, or an offer or solicitation to buy or sell any security, digital asset, or financial instrument. The information herein reflects the research findings of the authors as of the date of publication and is subject to change without notice. Readers should consult their own financial, legal, and tax advisors before making any investment decision.
Crypto Risk
Digital assets, including cryptocurrencies, are highly volatile and speculative. They may experience rapid and substantial price declines, including a total loss of value. Regulatory treatment of digital assets is evolving and uncertain, and future regulatory actions may materially affect the value, legality, and accessibility of digital assets. Digital asset markets operate 24/7 and are subject to operational, custodial, and cybersecurity risks not present in traditional financial markets.
Forward-Looking Statements
Certain statements in this document, including statements about future strategy behavior, detector performance, and projected improvements, involve known and unknown risks, uncertainties, and other factors that may cause actual results to differ materially. No representation is made that any stated objectives will be achieved. The strategy’s walk-forward results are not a guarantee of future live performance.
Third-Party Data / Competitor References
Characterizations of competing platforms’ features and methodologies in Section 6 are based on publicly available documentation and marketing materials as of the date of this study. CoinRoc has not independently tested competitor systems. Competitor product features, backtesting capabilities, and methodology documentation may have changed since this study was prepared. No representation is made as to the accuracy or completeness of competitor product descriptions.
Yodacom Research — 2026-06-09 · Companion to Paper 8: grid-modern-era-2026 · Han Kessel (research), Lando (editorial)
Paper 8 — Grid Trading in the Modern Crypto Era: 2019–2025
The 85-fold modern-era study that established the two-state FIS baseline. This paper (the Vault Test) extends Paper 8’s findings to the out-of-sample 2023–2025 window and evaluates the three-state upgrade.
Read Paper 8