
Disclaimer
This document is for informational and educational purposes only. It does not constitute investment advice, a recommendation, or an offer or solicitation to buy or sell any security, digital asset, or financial instrument. The information herein reflects the views of the authors as of the date of publication and is subject to change without notice.
All performance figures, return percentages, and grade outputs referenced in this document are derived from simulated, hypothetical backtesting conducted by Yodacom Research. These results were achieved by means of the retroactive application of a model to historical data with the benefit of hindsight. Hypothetical and simulated performance results have inherent limitations and do not represent actual trading. No representation is being made that any user will or is likely to achieve results similar to those shown. Simulated results do not account for real-world factors including but not limited to slippage, partial fills, order-book depth constraints, exchange downtime, custodial risk, or fee variations across configurations. All figures reflect the retail-binance-us fee tier, Year 2 blind forward test window, under a specific grid strategy configuration. Results will differ materially at other fee tiers, capital sizes, or grid configurations.
Past simulated performance is not indicative of, and is not a guarantee of, future results.
Digital assets, including cryptocurrencies, are highly volatile and speculative. They may experience rapid and substantial price declines, including a total loss of value. Regulatory treatment of digital assets is evolving and uncertain. Digital asset markets are subject to operational, custodial, and cybersecurity risks.
CoinRoc is a strategy analysis and simulation tool. It is not a registered investment advisor. CoinRoc's asset grades are outputs of a quantitative grading methodology applied to simulated historical data; they are not investment recommendations, suitability assessments, or endorsements of any specific asset. Readers should consult their own financial, legal, and tax advisors before making any investment decision.
Information derived from third-party sources (including CoinGecko, Binance.US, and other exchange data providers) is believed to be reliable but has not been independently verified. No representation is made as to its accuracy or completeness.
The Fiduciary Problem with Backtests
When a client asks whether a strategy “worked,” the honest answer depends on three things the backtest alone cannot tell you: whether the strategy was running during the period you are measuring, whether the market could actually execute the orders, and whether the performance number presented is a simulation or a live result.
CoinRoc's grading system goes beyond the simulation — and the methodology behind that decision is worth understanding before recommending or dismissing any grid-based strategy.
This article explains two recent methodology changes to CoinRoc's asset grading system: how grades are now adjusted for regime-gated periods when the strategy is correctly inactive, and how grades are capped when an asset's order book cannot reliably support the execution implied by a clean backtest. Together, these changes represent what Yodacom Research calls execution-aware grading — a grading methodology that is explicit about when a strategy was running and whether the market can fill it.
What a Blended Return Hides
CoinRoc's grid strategy operates under the direction of a regime-classification system (Adaptive Grid RXI) that classifies market regimes and determines whether conditions are suitable for grid trading. When the market is strongly trending — the environment where grid strategies historically lose — the RXI pauses new grid buy orders: existing inventory continues to be managed by the strategy, but no new capital is deployed into the grid until conditions improve. This is intended design behavior, not a bug.
The problem arose in how the previous grading system evaluated performance: it used a blended full-period return — total portfolio return across the entire evaluation window, including periods when the RXI had correctly paused new buys. For an asset that trended down 40% while the RXI was in a paused state, the blended return absorbed that 40% directional move even though the grid strategy had deliberately not participated in it.
The practical distortion was significant. In the 97-asset catalog analyzed by Yodacom Research, approximately 37 assets were being hidden from Discovery by a performance filter based on this blended return metric (pre-fix, based on simulated blended returns). Earlier versions of this page reported simulated returns; we've withdrawn them while we rebuild our simulator with stricter assumptions.
For due-diligence purposes: the appropriate question to ask about any grid strategy grade is not “what was the portfolio return over this period?” but “what was the grid mechanism's return during the windows when it was running?” These can diverge substantially in trending markets. A grade that blends the two gives you a number that corresponds to neither question cleanly.
Why a Beautiful Backtest Is Not Always a Reliable Grade
The second methodology change addresses a different dimension of the simulation-to-execution gap: order book depth.
Grid trading places multiple simultaneous resting limit orders across a defined price range. Each individual fill is relatively small, but fills must occur at multiple price levels for the strategy to function as backtested. The standard backtest assumption — fills at the grid price with no market impact — is reasonable for assets with deep, liquid order books. It is a material assumption violation for assets whose total global 24-hour trading volume is in the low millions of dollars.
Prior to this methodology update, CoinRoc's grade composite included a liquidity component carrying a 5% weight, but that component had null values for 91 of 93 graded assets due to a data collection issue. The practical result: 91 assets were being graded almost entirely on simulated return and risk-adjusted ratios, with no signal about whether fills at the simulated price were achievable in the actual market.
The corrected methodology introduces a composite liquidity score (0–100) drawing on four signals: 30-day median global 24-hour volume (50% weight, currently proxied by a single-day snapshot pending 30-day history accumulation), bid/ask spread as a percentage (25%), order book depth at ±2% (20%), and estimated slippage for a $10,000 order (5%). Assets with a composite score below 35 — roughly equivalent to under $5 million in daily global volume — are flagged as thin liquidity.
For thin-liquidity assets whose simulated backtest would otherwise produce a grade of A or B, a grade cap is applied at B-. The asset remains visible in the Discovery catalog; its grade renders with a disclosure label and tooltip explaining that the grade reflects actual execution risk, not raw backtest return.
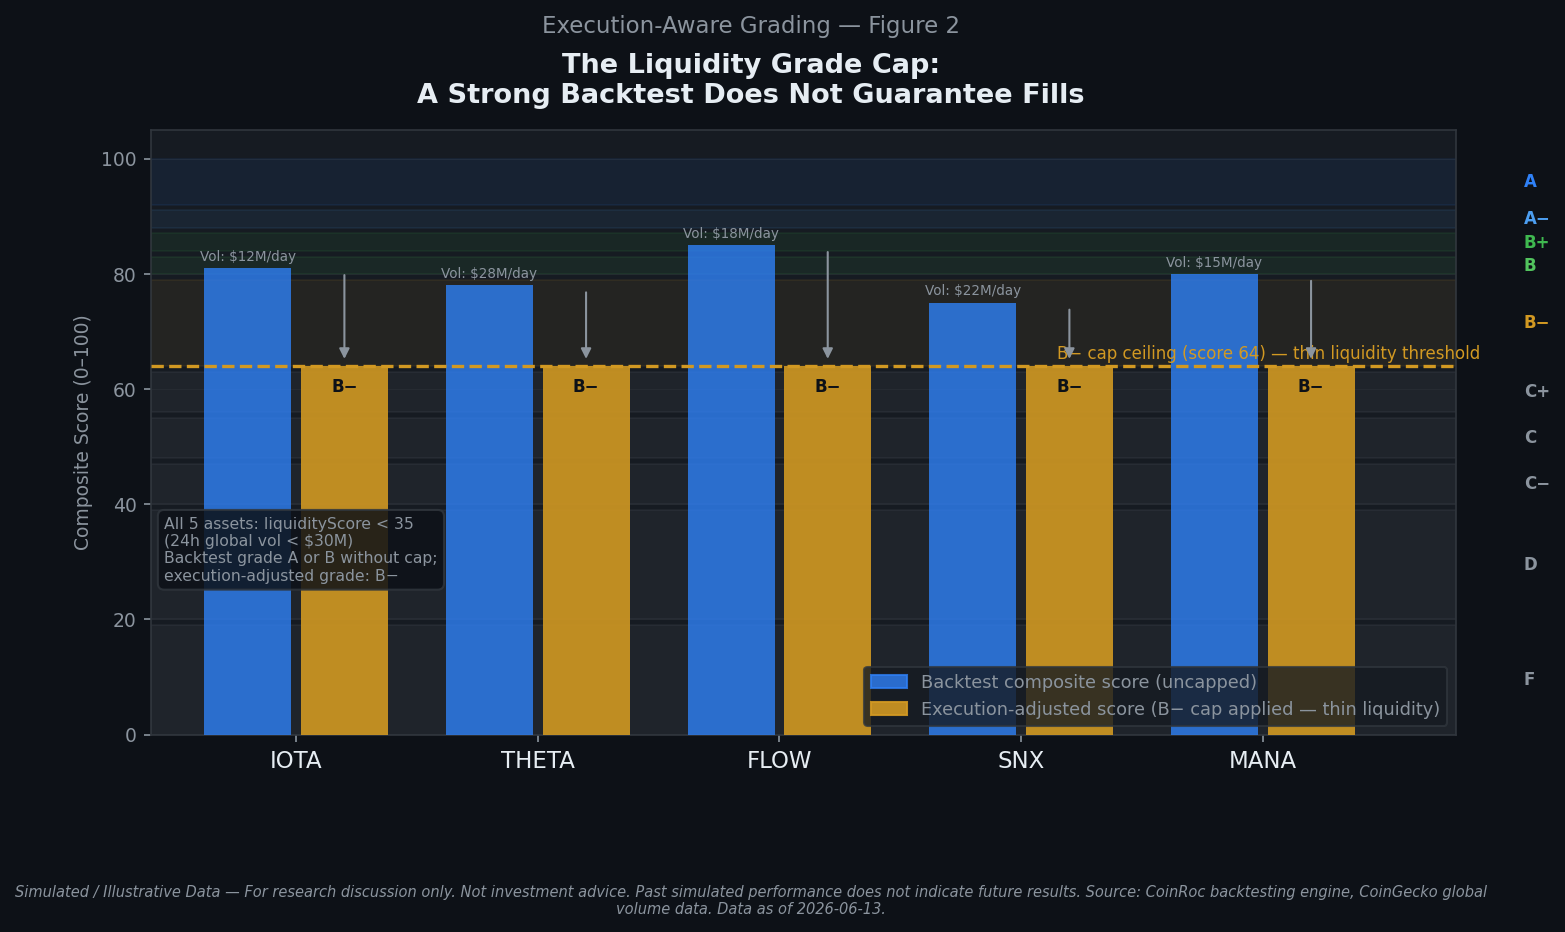
This is the counterintuitive implication of execution-aware grading: a strong backtest can result in a lower published grade. An asset that simulates at A-level return on a thin order book does not receive an A — because an A implies an execution quality the order book may not be able to support at the simulated scale. The simulated return becomes an optimistic scenario estimate under idealized fill conditions — not a characterization of what the strategy will achieve in live trading.
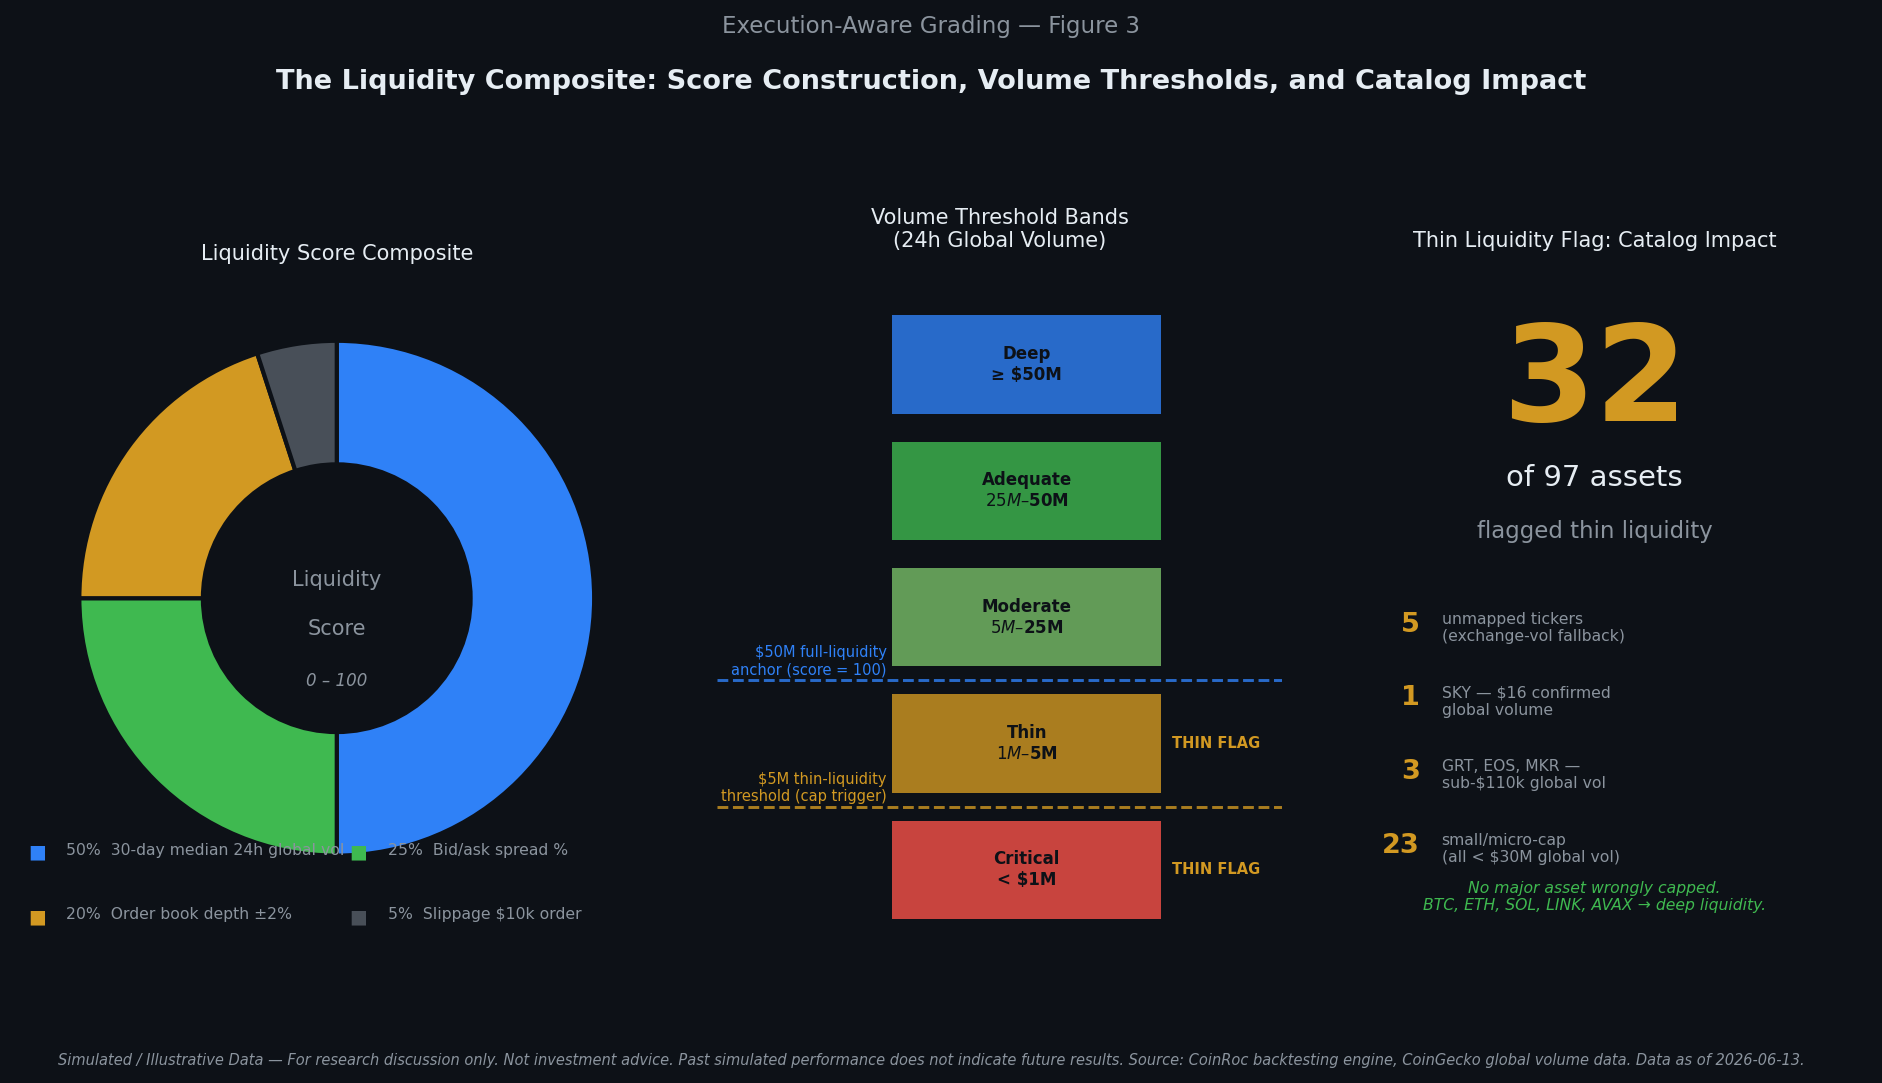
In the full 97-asset catalog, 32 assets currently carry the thin-liquidity flag. None of the major assets — BTC, ETH, SOL, LINK, AVAX — are affected. The flagged assets are micro-cap and small-cap positions where meaningful grid execution at scale is not supported by current order book depth.
What This Means for Client Conversations
The practical implication for advisors is this: when a client asks about a specific asset's grade in CoinRoc, the grade now tells a more complete story than a raw backtest number would.
A B- with a thin-liquidity disclosure does not mean the asset is unsuitable. It means the simulated return should be treated as an optimistic scenario; actual execution at meaningful position sizes may produce worse fills. For a client running a smaller grid configuration, the asset may be entirely appropriate — the grade is calibrated to a general execution risk level, not a specific capital amount. A deployment-time warning that accounts for the interaction between position size and order book depth is on the methodology roadmap.
An asset hidden with the label “Grid underperforms at your fee tier even in favorable market conditions” had a simulated active-period return below the filter threshold under the then-current simulator. That is a different category from an asset hidden only because of market direction during a paused period.
Methodology Transparency as a Fiduciary Signal
The documentation driving these changes — published in full in the Yodacom Research report — quantifies precisely what changed, why the previous metric was measuring the wrong thing, and where the current methodology still has limitations. The 30-day volume proxy is documented as a single-day snapshot pending accumulation of collection history. The flat-slippage assumption in the backtest engine is explicitly bounded. The RXI regime accuracy question is named as a separate validation problem that remains open.
That level of disclosure is also what a fiduciary standard requires: understanding the assumptions and their limits, not just the headline number.
Execution-aware grading is not a claim that the system predicts actual returns. It is a claim that the grade measures what it says it measures — and documents clearly where it cannot.
Disclaimer
This document is for informational and educational purposes only. It does not constitute investment advice, a recommendation, or an offer or solicitation to buy or sell any security, digital asset, or financial instrument. The information herein reflects the views of the authors as of the date of publication and is subject to change without notice.
All performance figures, return percentages, and grade outputs referenced in this document are derived from simulated, hypothetical backtesting conducted by Yodacom Research. These results were achieved by means of the retroactive application of a model to historical data with the benefit of hindsight. Hypothetical and simulated performance results have inherent limitations and do not represent actual trading. No representation is being made that any user will or is likely to achieve results similar to those shown. Simulated results do not account for real-world factors including but not limited to slippage, partial fills, order-book depth constraints, exchange downtime, custodial risk, or fee variations across configurations. All figures reflect the retail-binance-us fee tier, Year 2 blind forward test window, under a specific grid strategy configuration. Results will differ materially at other fee tiers, capital sizes, or grid configurations.
Past simulated performance is not indicative of, and is not a guarantee of, future results.
Digital assets, including cryptocurrencies, are highly volatile and speculative. They may experience rapid and substantial price declines, including a total loss of value. Regulatory treatment of digital assets is evolving and uncertain. Digital asset markets are subject to operational, custodial, and cybersecurity risks.
CoinRoc is a strategy analysis and simulation tool. It is not a registered investment advisor. CoinRoc's asset grades are outputs of a quantitative grading methodology applied to simulated historical data; they are not investment recommendations, suitability assessments, or endorsements of any specific asset. Readers should consult their own financial, legal, and tax advisors before making any investment decision.
Information derived from third-party sources (including CoinGecko, Binance.US, and other exchange data providers) is believed to be reliable but has not been independently verified. No representation is made as to its accuracy or completeness.
Read the Full Methodology
Han Kessel's full research report — including the complete liquidity score composite, the active-period return methodology, data caveats, and limitations — is available at yodacom.com/research.
LANDO-EXEC-GRADING-ADVISOR-01 — Lando, Senior Content Writer & Strategist, Yodacom AI Team.